

Round the Bridges | 88% Diversion
How Round the Bridges Achieved 88% Waste Diversion in a High-Traffic Public Event
Designing a waste system for a large-scale public sporting event, with high attendee movement, minimal vendor control, and complex waste streams.
Location: Hamilton
Event type: Sporting event
Event duration: 1 day
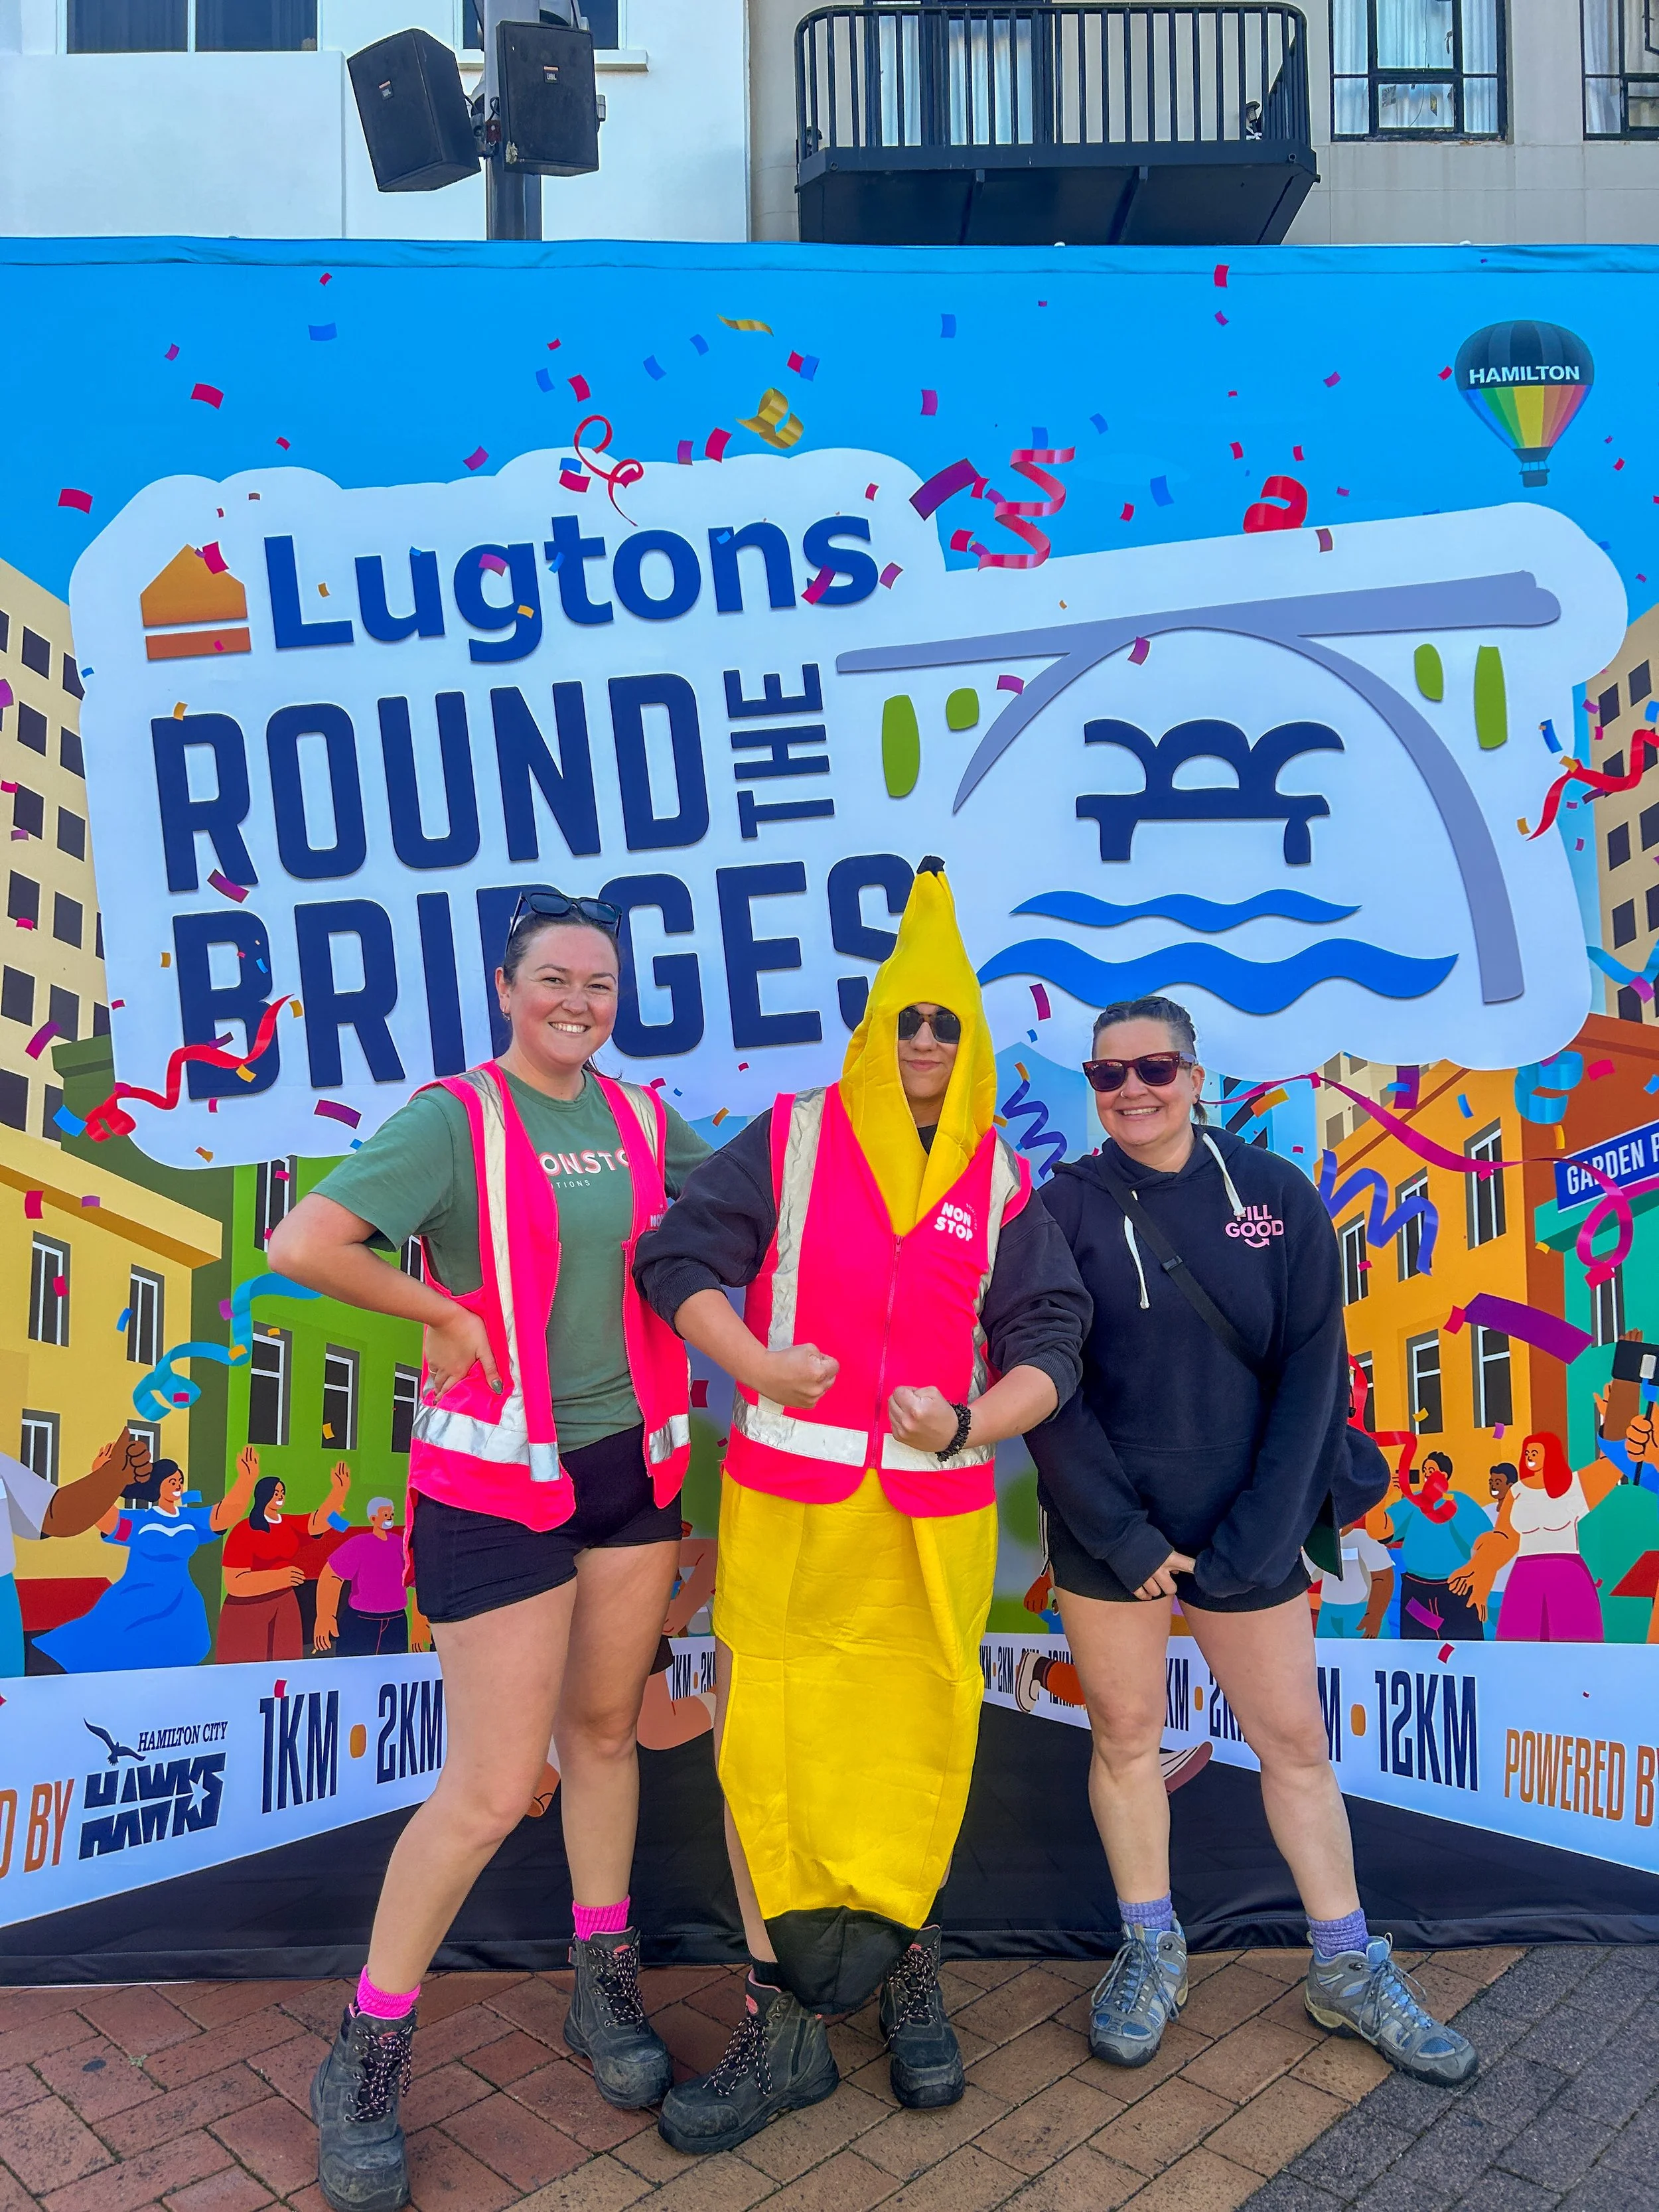
Lugton’s Round the Bridges is one of New Zealand’s longest-running community events, attracting over 7,000 participants to Hamilton’s city centre.
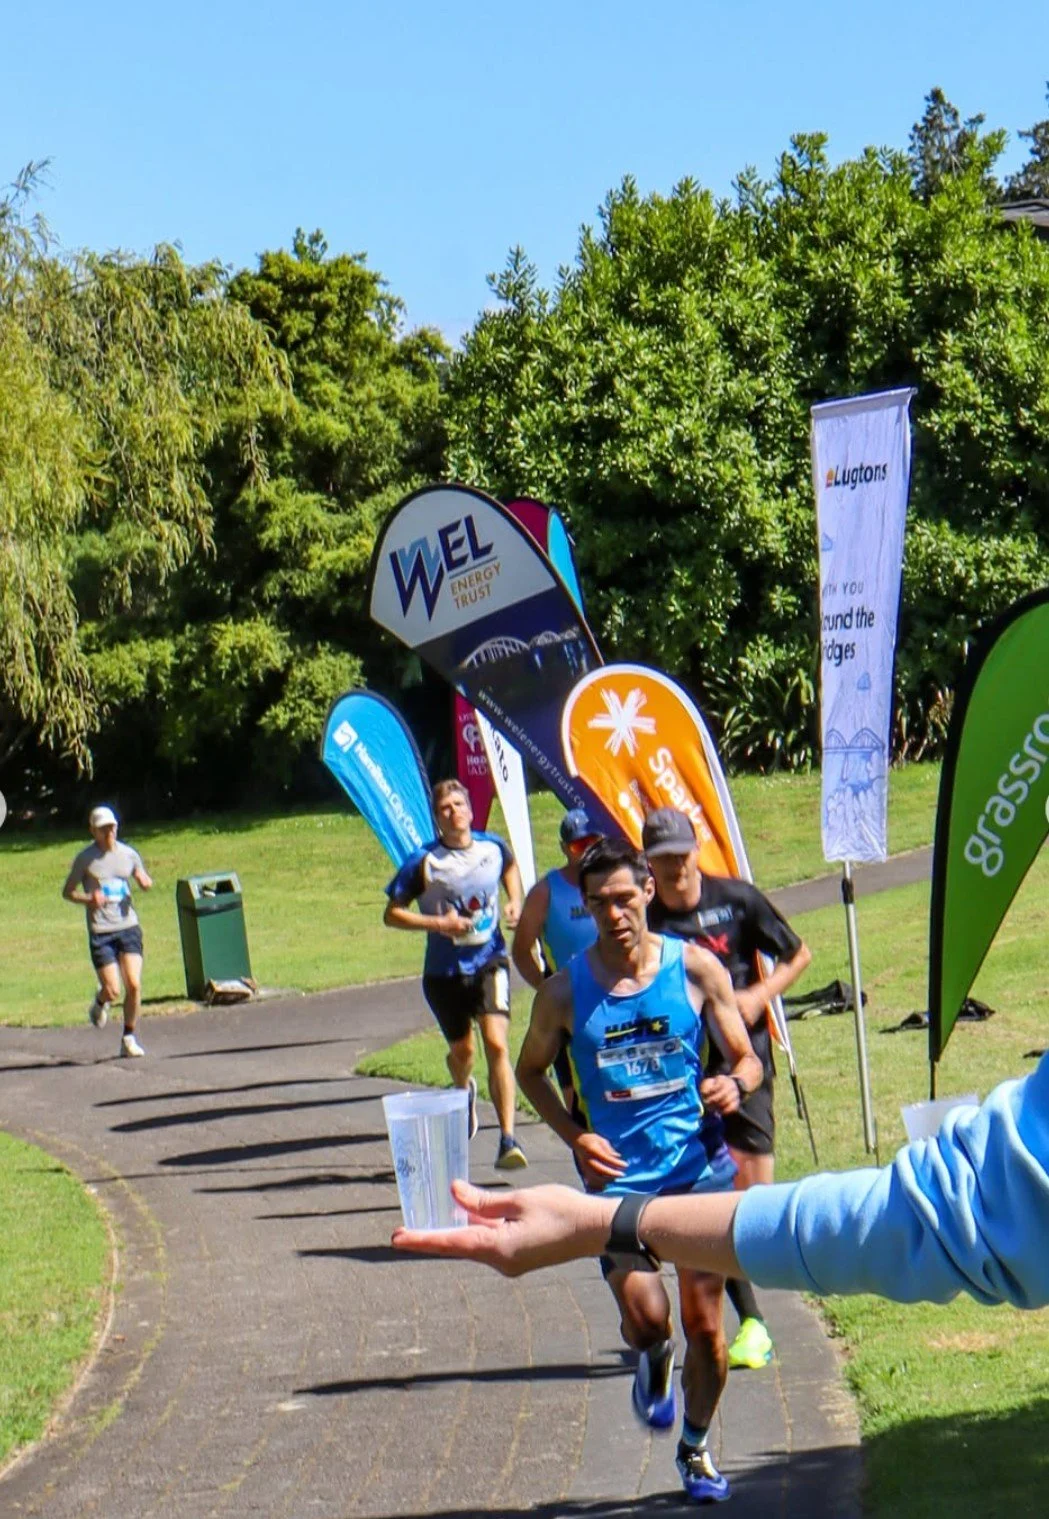
Unlike contained festivals, the event operates across open public spaces, with waste generated along the course, at hydration stations, and at the finish line.
Nonstop Solutions was engaged to design and deliver a waste minimisation system, establishing a baseline for future sustainability improvements.
Key outcomes:
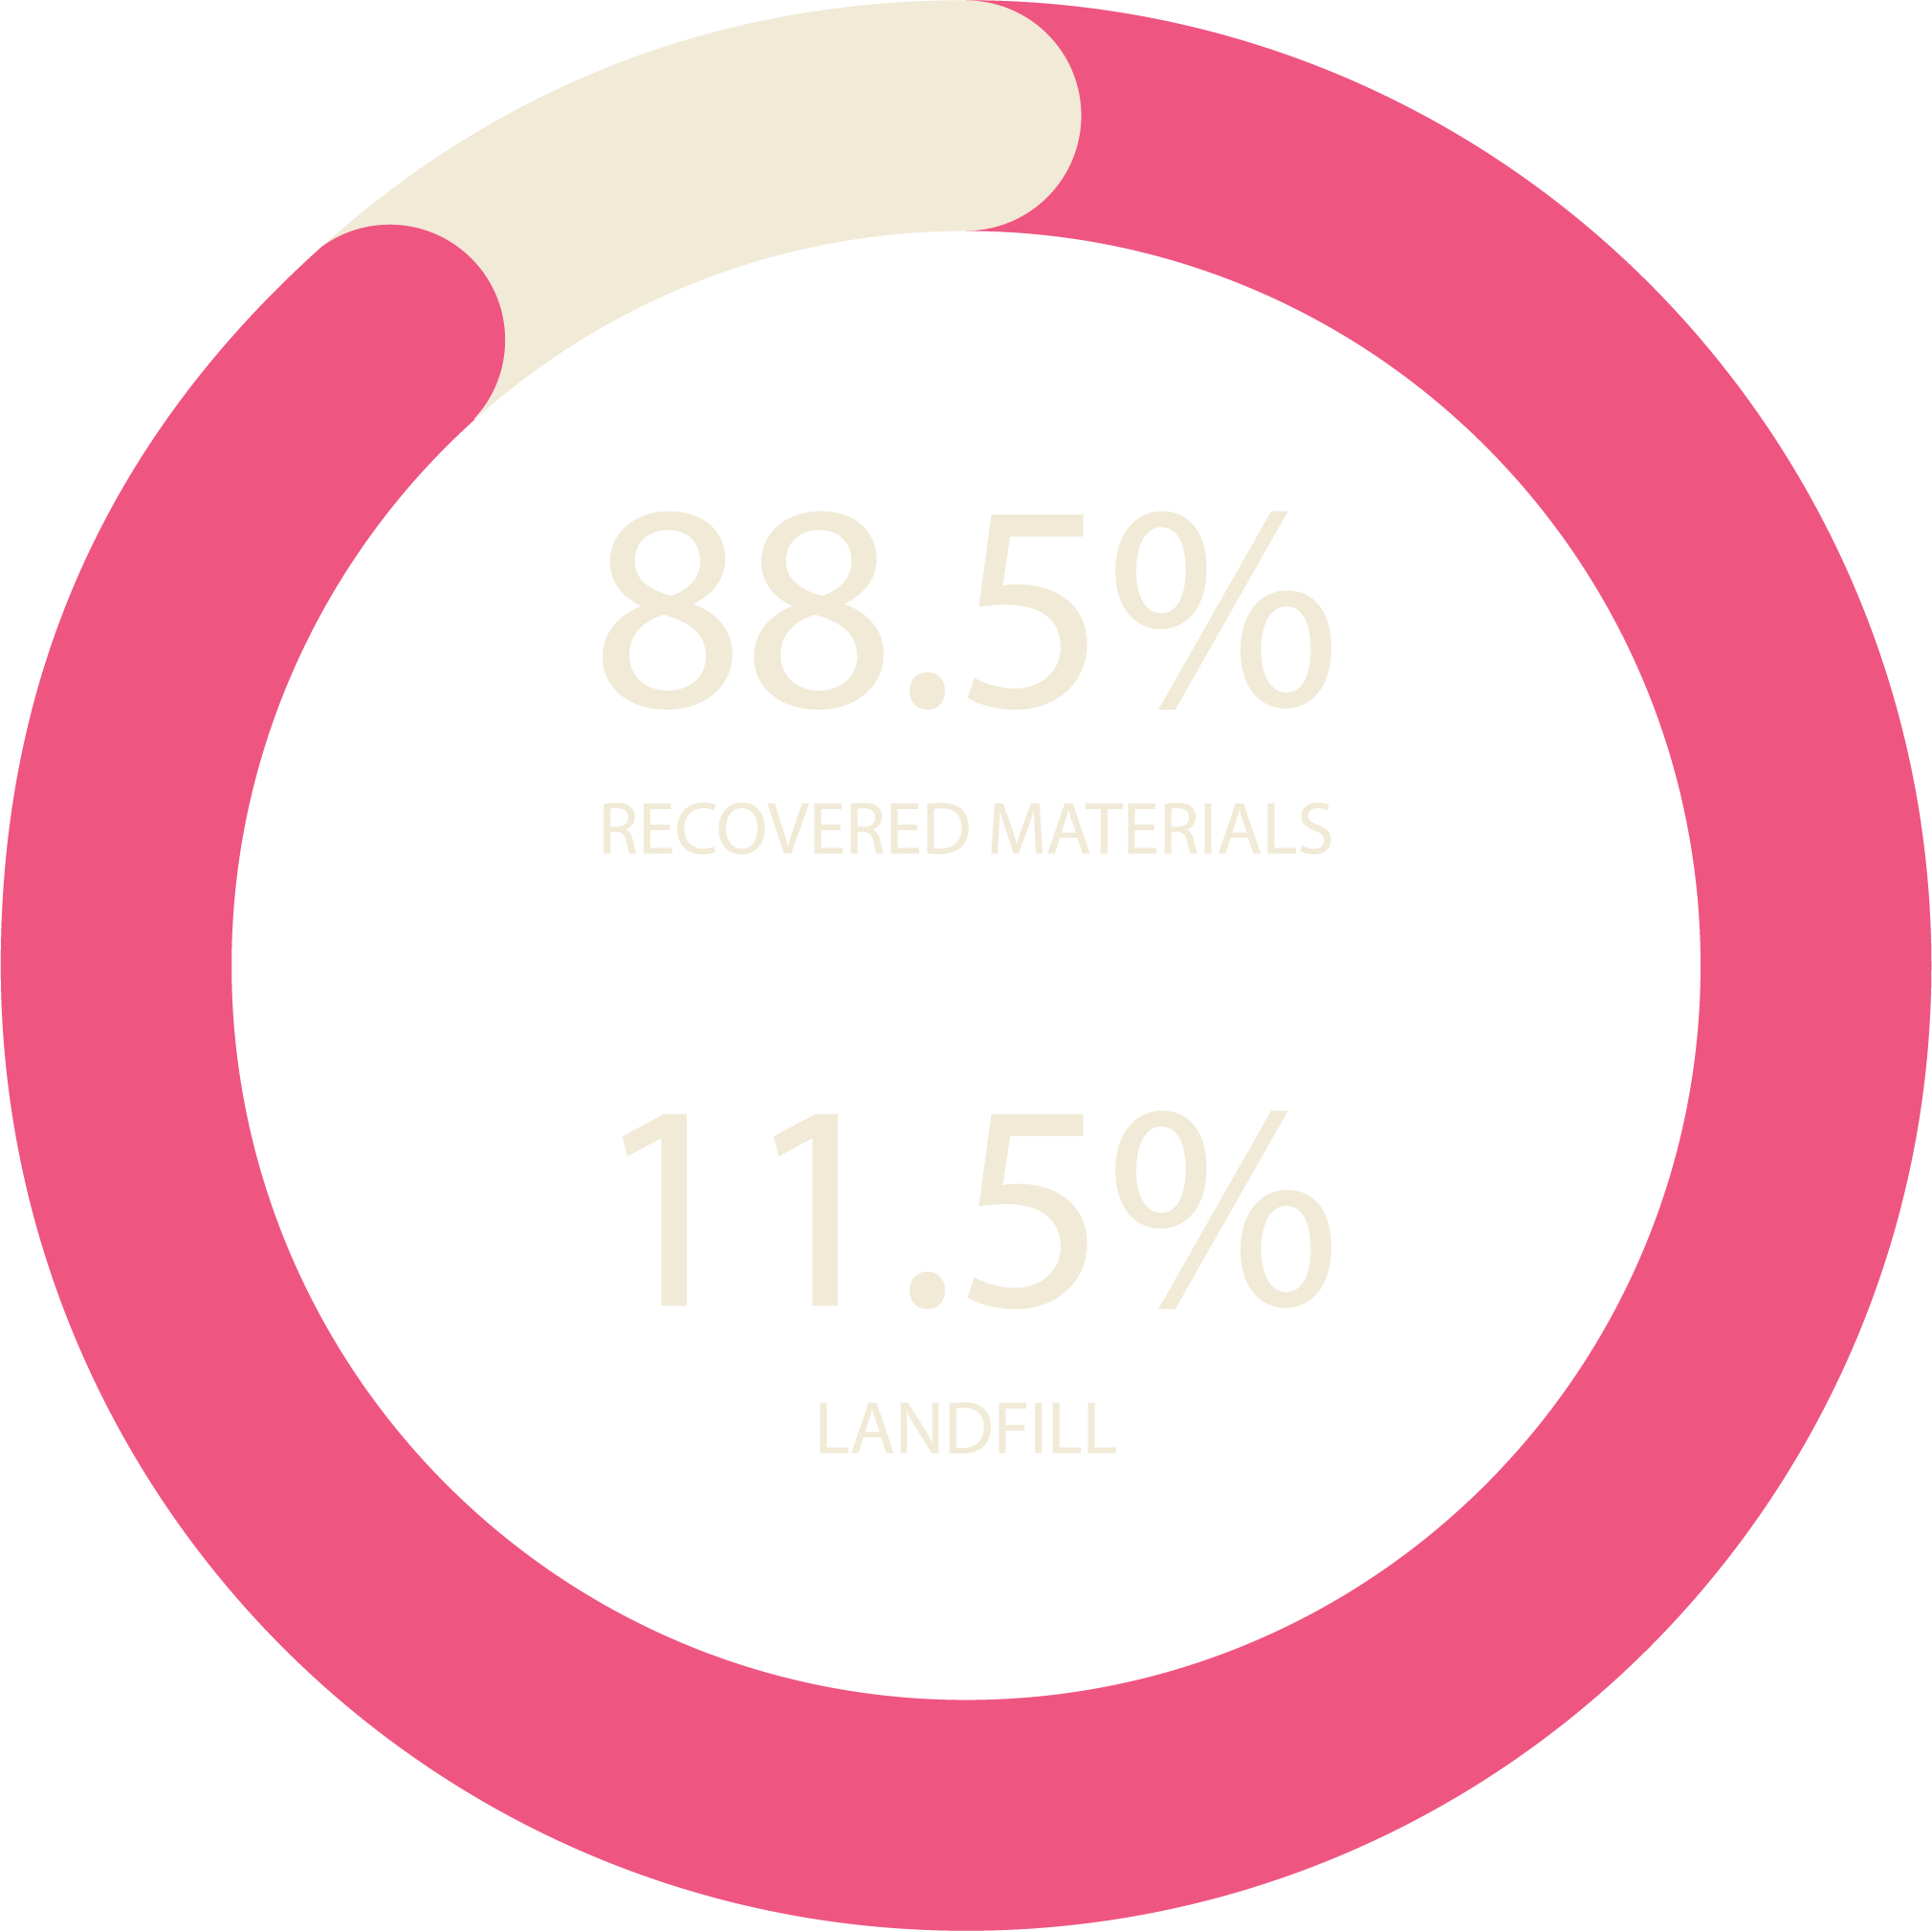
88.5% resource recovery rate
529.4 kg of waste audited
468.4 kg recovered from landfill
10,000 reusable cups deployed across hydration stations
This marked the first year of partnership, creating a strong foundation for future system improvements.
Delivering waste recovery at a public sporting event introduces unique constraints:
highly distributed waste generation (across course + finish line)
limited control over attendee behaviour
minimal vendor influence
external waste entering the system (public + surrounding businesses)
high-volume single-use consumption (hydration + nutrition products)
The system needed to perform in a fast-moving, high-volume environment, where convenience often overrides correct waste sorting.
The System We Implemented
A multi-layered waste system was designed to manage waste at every stage. From vendor setup through to post-event sorting.

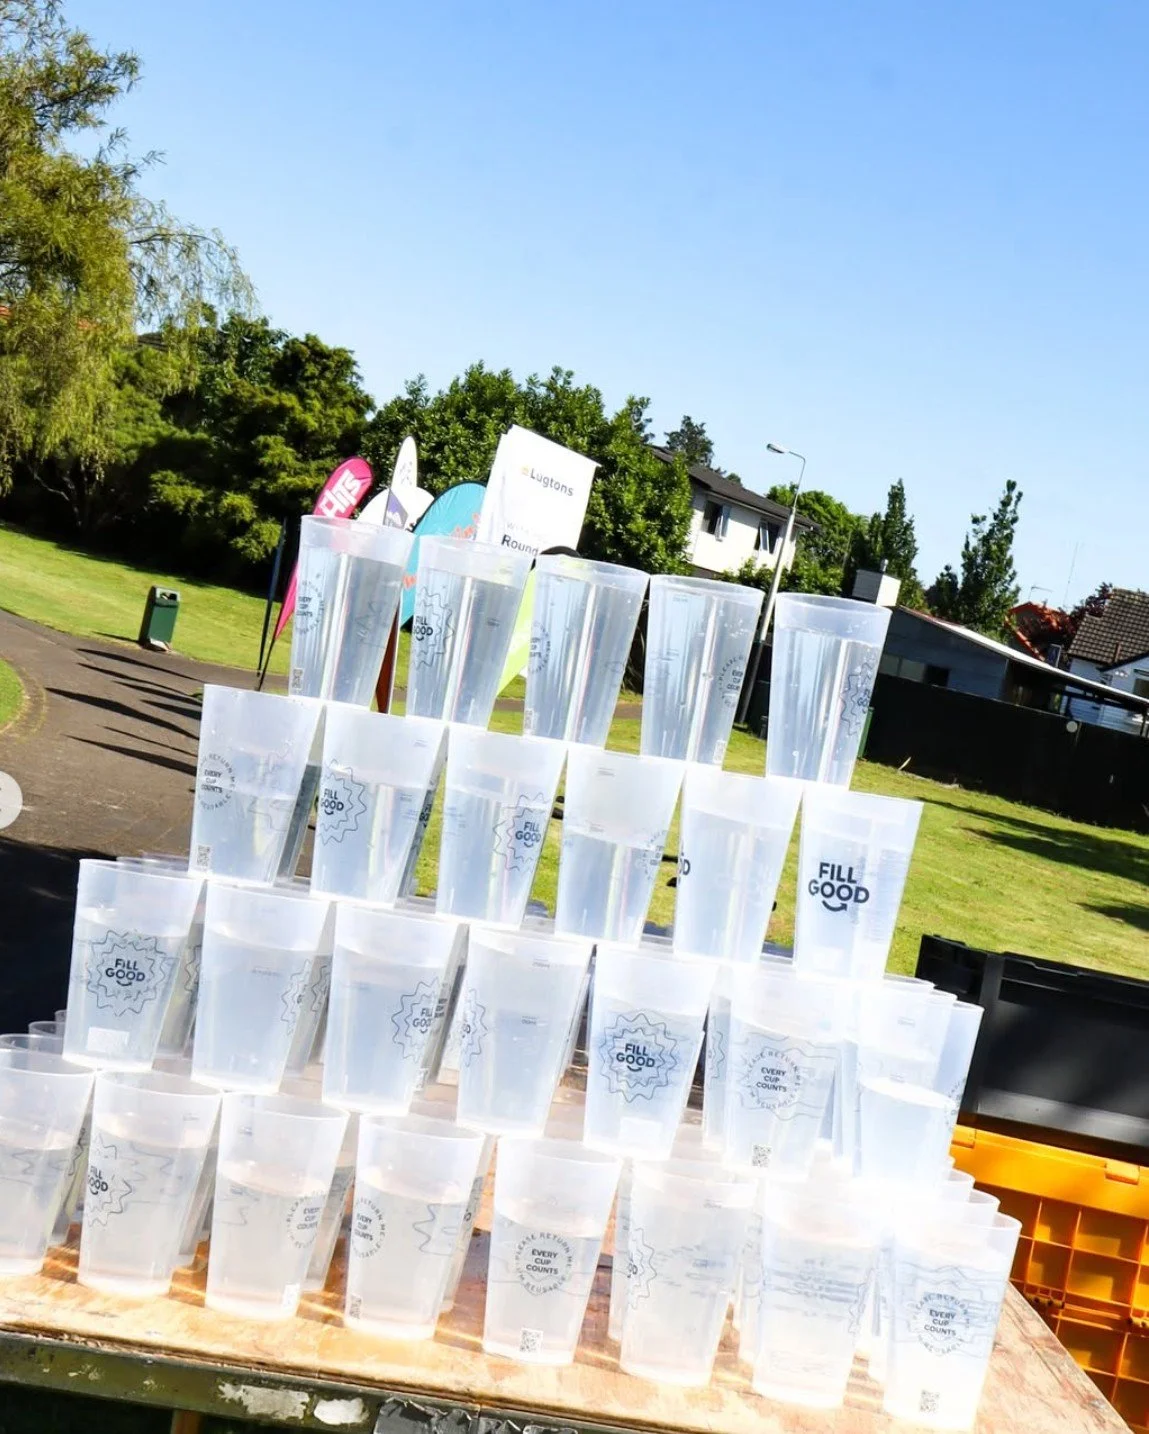
Reusable Hydration System
A major system shift was introduced through reusable cups at hydration stations.
10,000 reusable cups deployed
100% replacement of single-use cups along the course
This eliminated a significant source of single-use waste at one of the highest-volume touchpoints.
Round the Bridges’ sustainability outcomes were supported through collaboration with partners including FillGood, who delivered the reusable hydration system across the course.
You can read more about the event’s sustainability initiatives here:
→ View Round the Bridges sustainability page
→ View FillGood case study

Targeted Resource Recovery Stations
8 recovery stations were installed across key areas, supported by:
compost, recycling, and landfill streams
“banana peel only” bins to improve sorting accuracy
bin educators to guide attendees
Stations were concentrated in high-traffic areas such as the finish line to maximise effectiveness.

On-Site Sorting & Recovery
All waste was transported to a central recovery zone and hand-sorted into multiple material streams.
This process:
increased recovery accuracy
reduced contamination
enabled detailed auditing of waste composition

Active Waste Management
Nonstop teams managed:
bin servicing throughout the event
litter sweeping across the course
real-time adjustments to bin placement
This ensured the system remained functional during peak periods.
Key Findings
Waste Diversion
Round the Bridges achieved an 88.5% resource recovery rate, significantly exceeding the initial 50% target.
This demonstrates that well-designed systems can deliver strong outcomes even in open, high-traffic public environments.
Target: 50% → Achieved: 88.5%
Where Waste Was Diverted
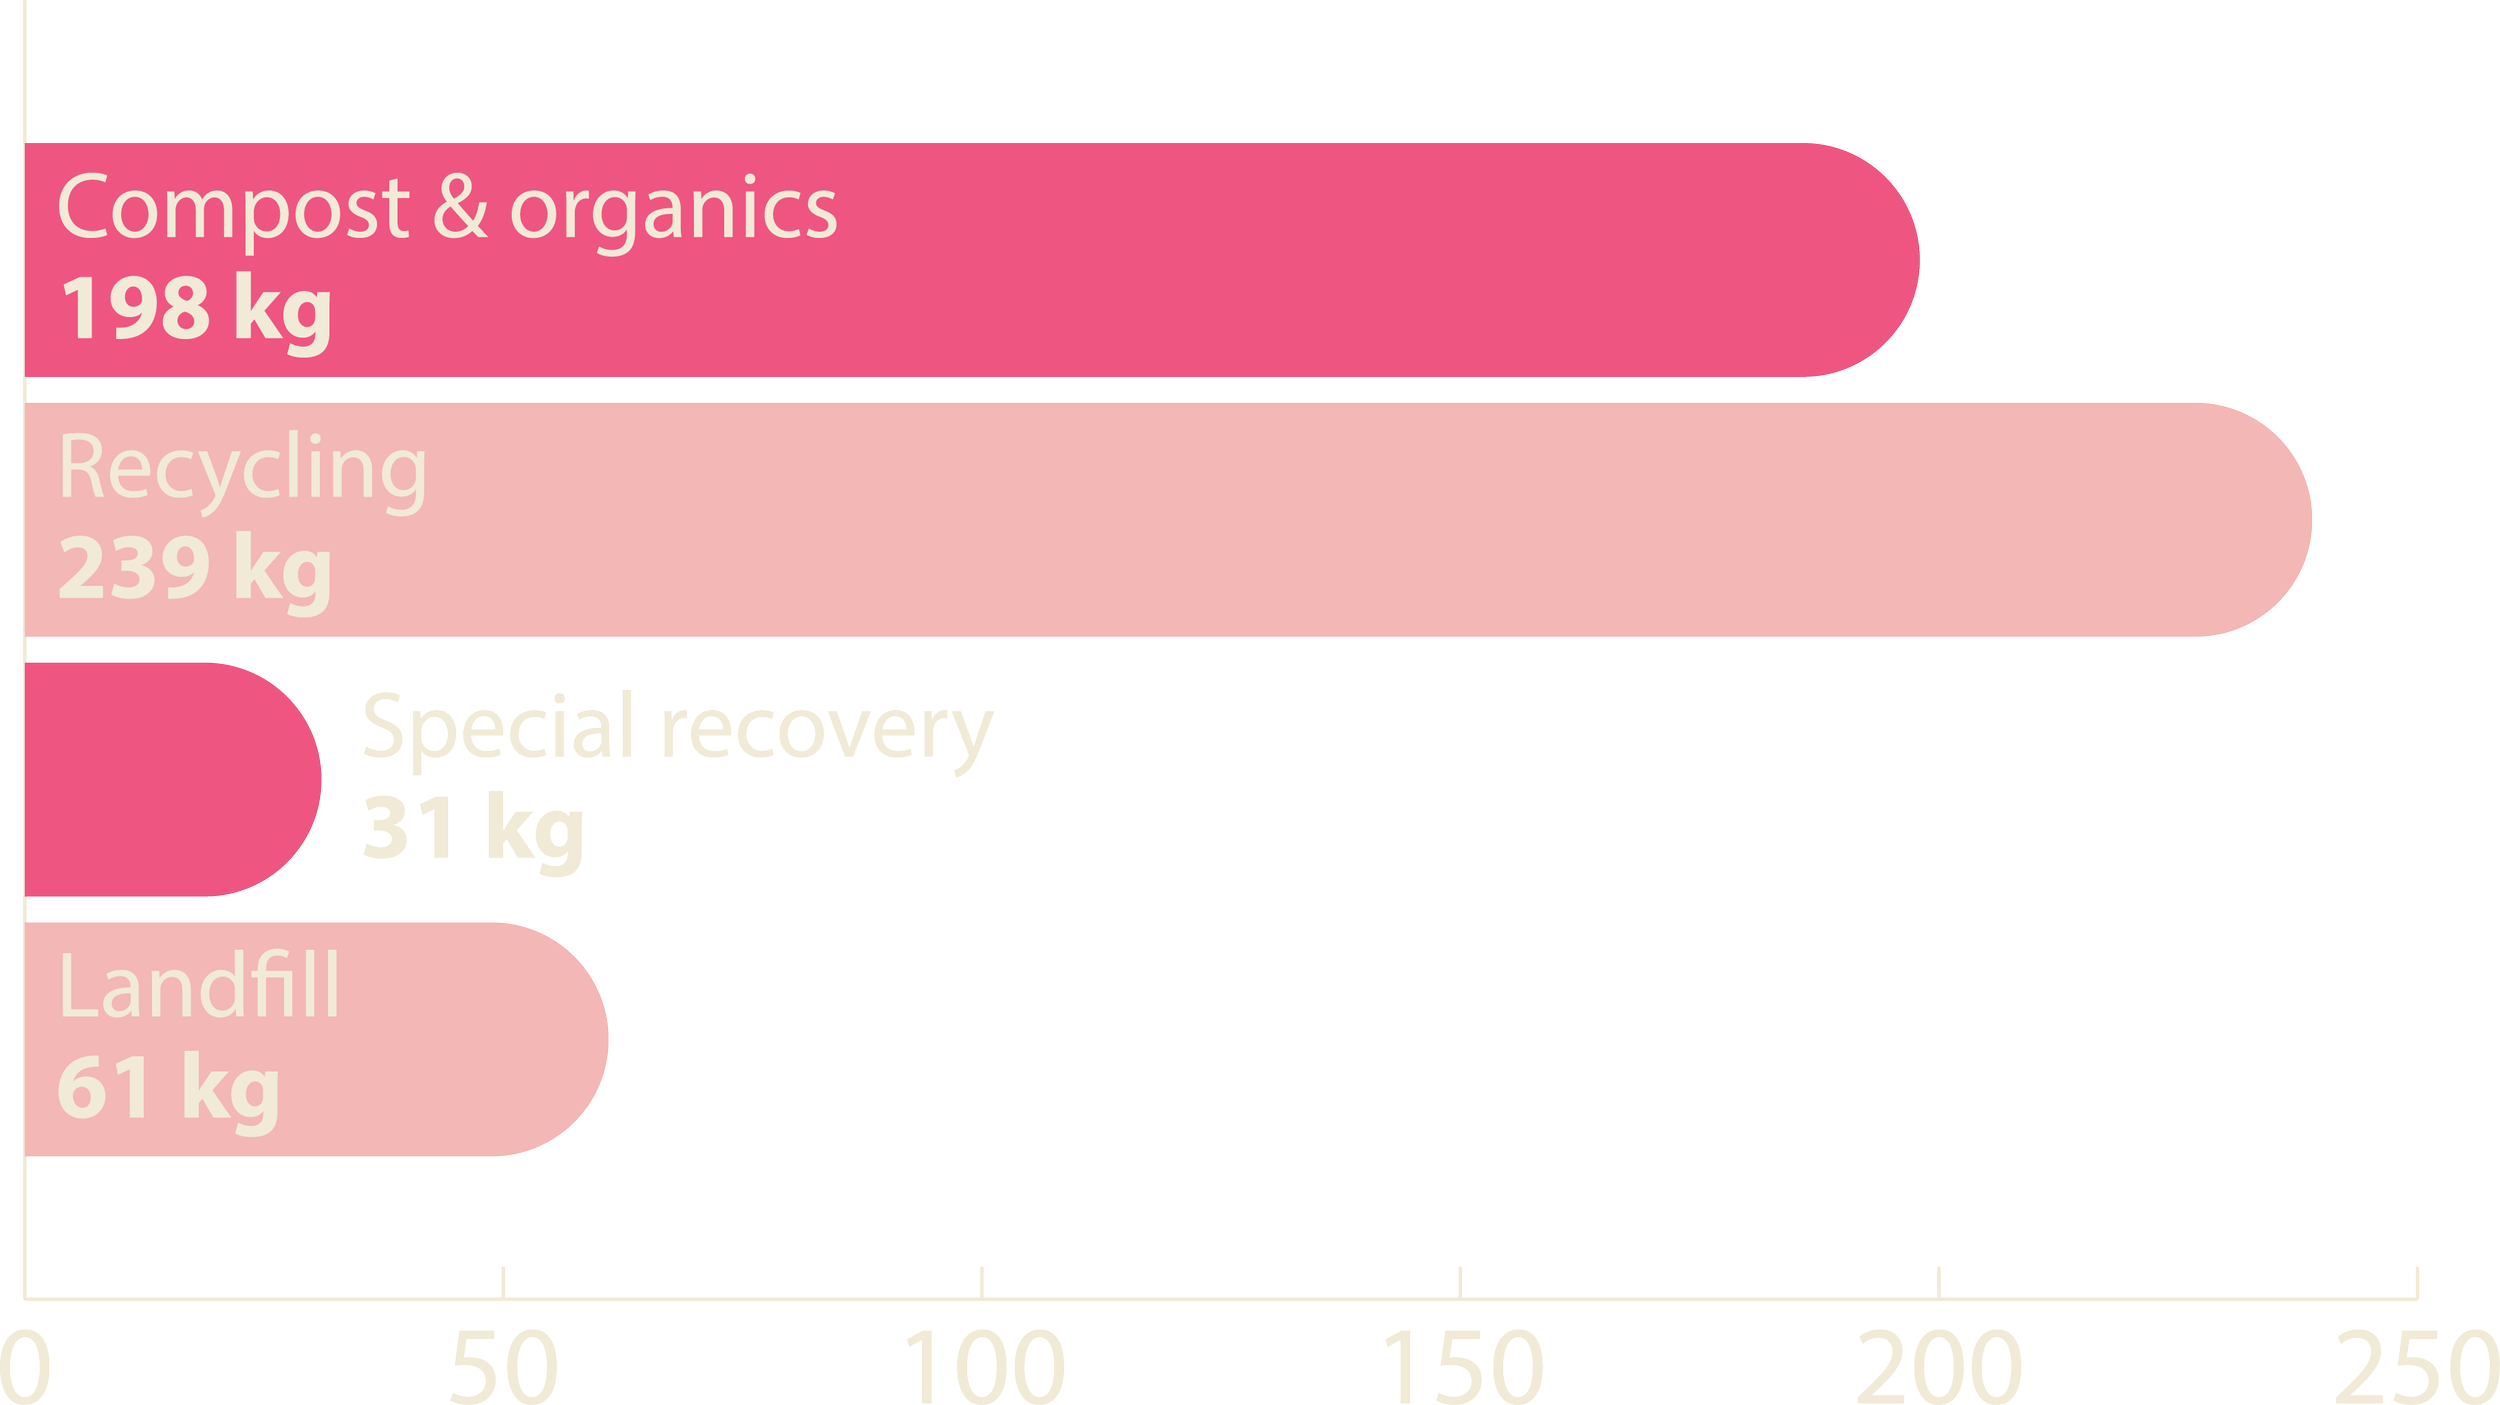
Waste at Round the Bridges was managed across composting, recycling, specialist recovery, and landfill streams.
Compost & organics: 198 kg
Recycling: 239 kg
Special recovery: 31 kg
Landfill: 61 kg
These outcomes reflect a system designed to capture high-volume materials while maintaining strong recovery performance across mixed waste streams.
Material Insight: Bananas & Cardboard
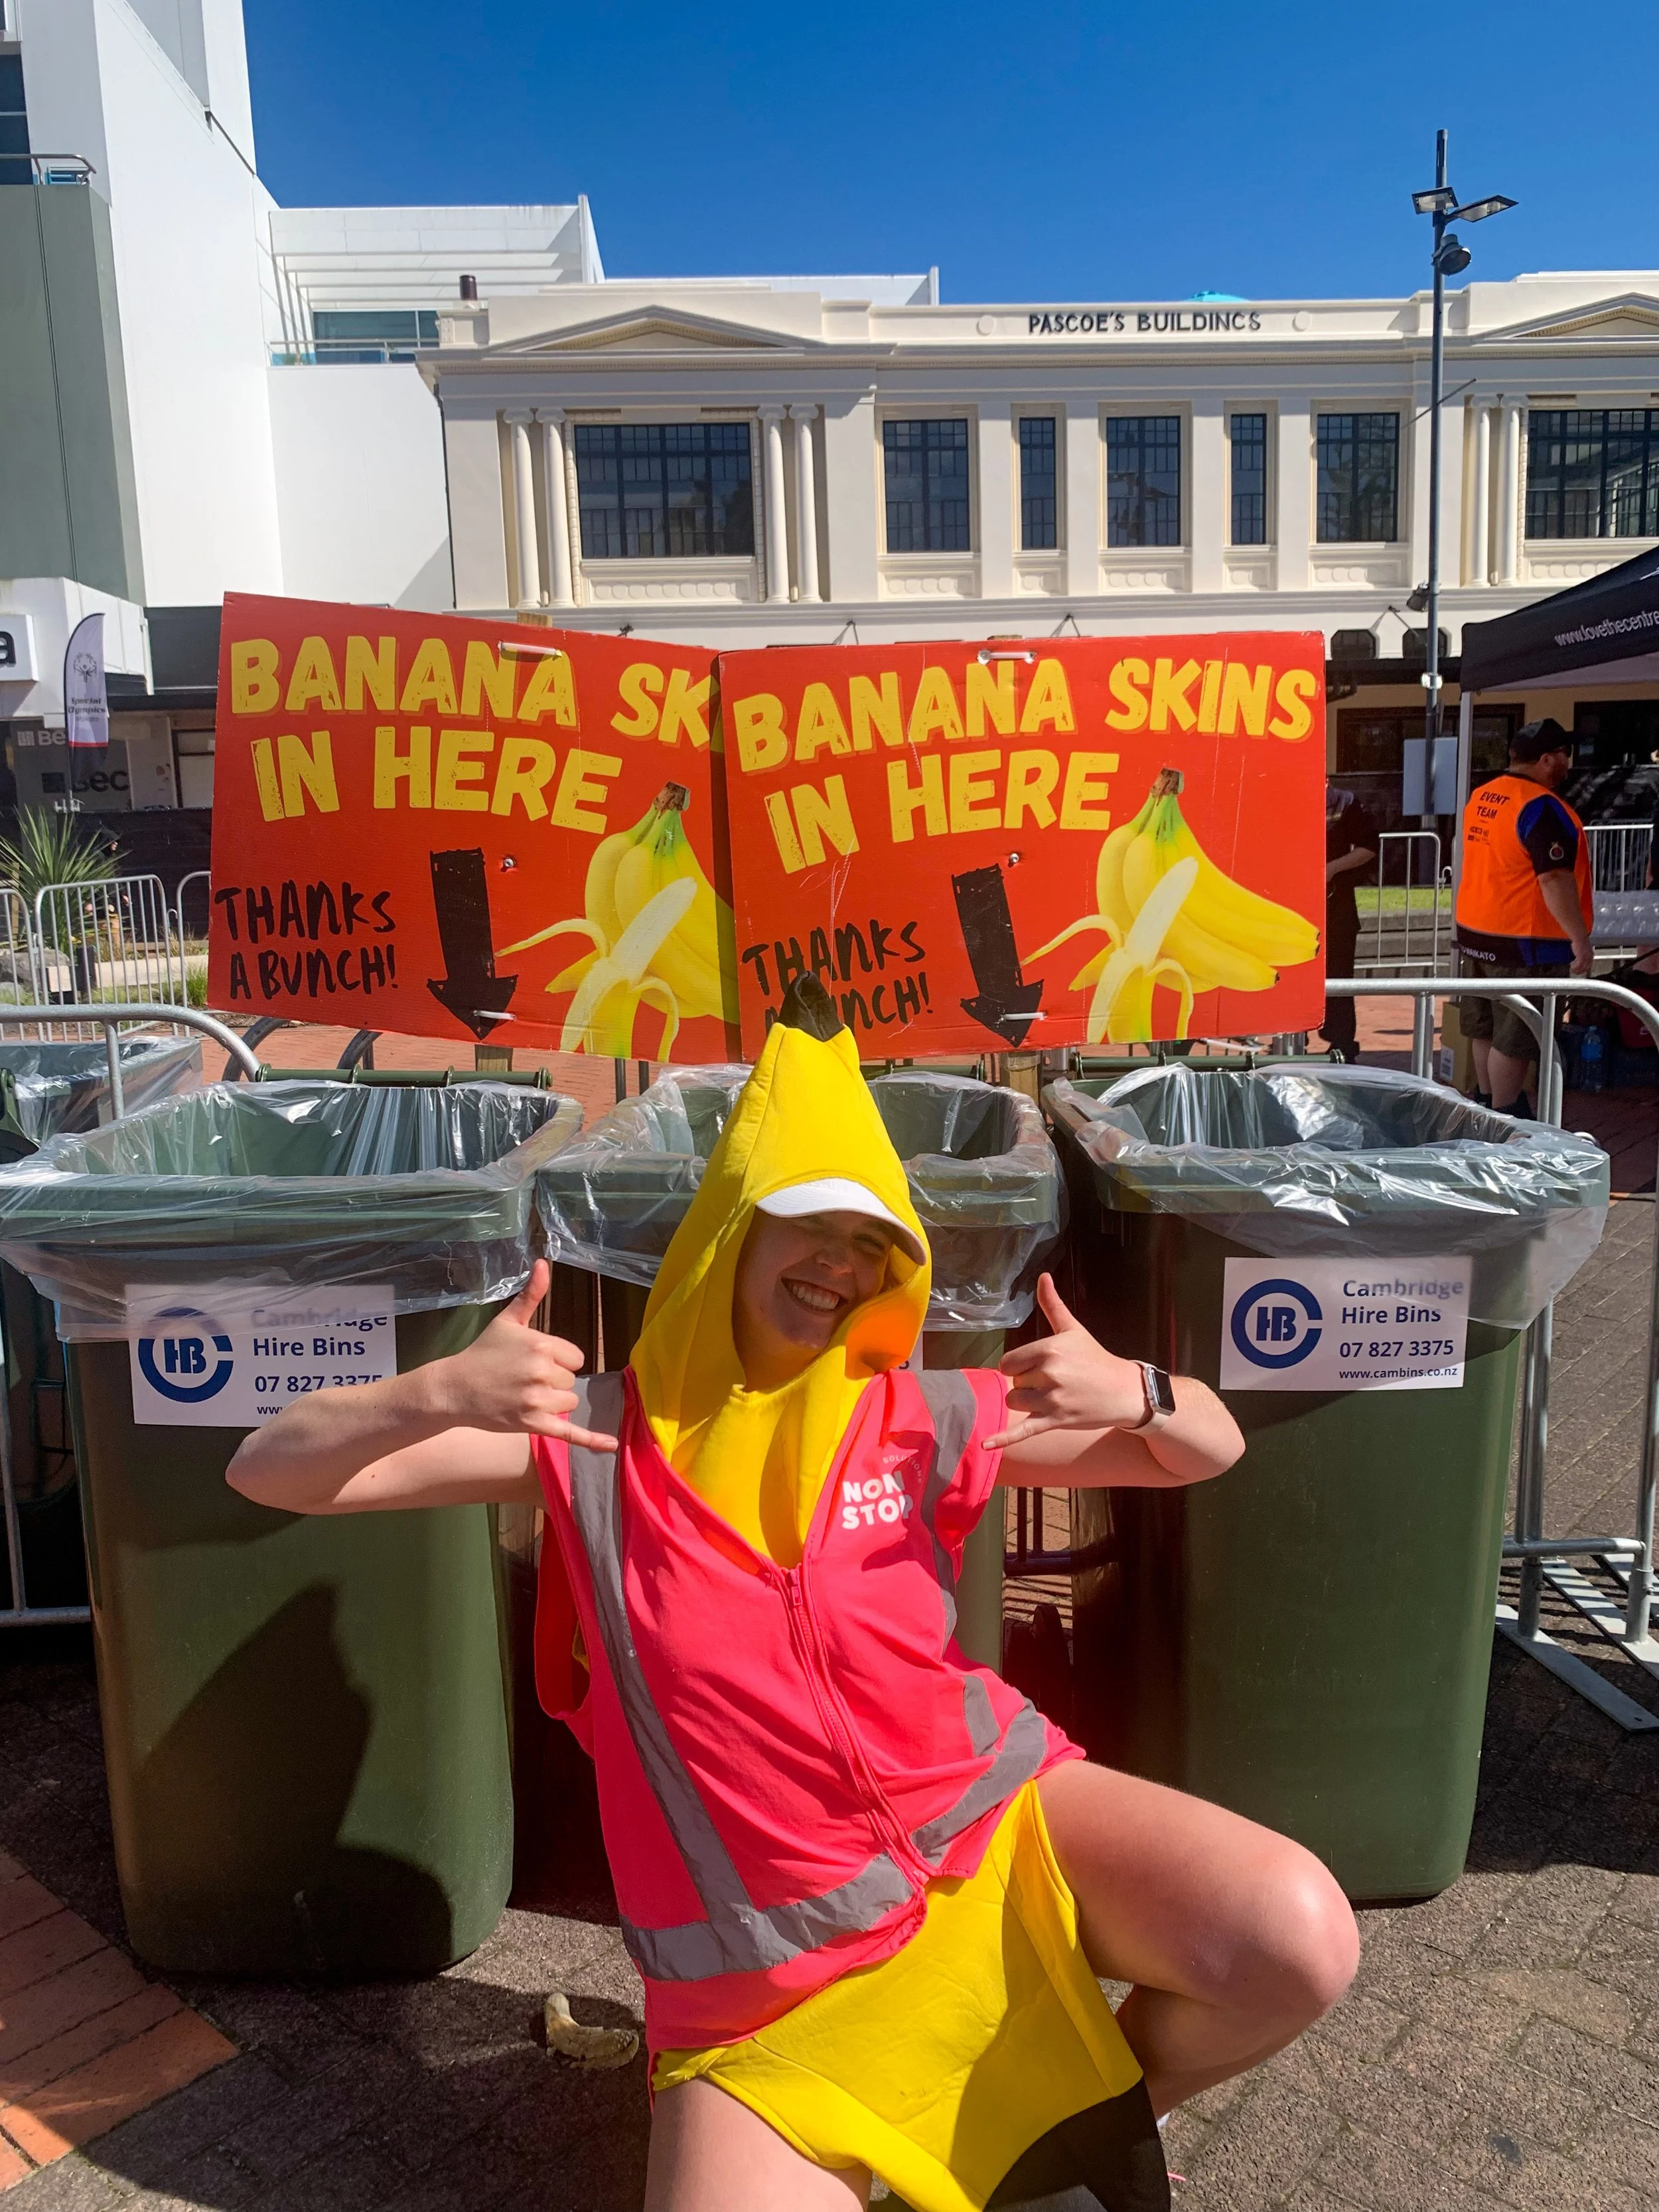
A significant proportion of waste came from just two sources:
Food scraps (primarily bananas): 37.1%
Cardboard: 28.1%
Together, these accounted for 65.1% of total waste generated.
This highlights how waste at sporting events is often driven by a small number of high-volume materials.
Why this matters:
These materials are:
highly recoverable
predictable
directly linked to event design
This presents a clear opportunity to optimise systems around known waste streams.
System Insight
To better understand the remaining waste, these dominant streams were removed from analysis.
Result:
67% recovery rate for remaining materials
This shows:
high recovery is partly driven by predictable materials
mixed waste streams remain more challenging
future improvements should focus on complex materials + behaviour
Opportunities for Improvement
Based on system performance:
extend reusable cups to the finish line
replace single-use sports drink bottles with bulk refill systems
improve signage visibility and consistency
introduce stronger vendor packaging controls
These changes would further reduce landfill and improve recovery rates.
Attendee Behaviour & Engagement
Attendee engagement was strongest at key touchpoints, particularly the finish line where bin educators were present.
However, behaviour patterns such as:
staying in shaded areas
convenience-based disposal
external food packaging
highlight the importance of system design that works with, not against, human behaviour.
Looking Ahead
Round the Bridges demonstrates that high recovery rates are achievable even in complex, open environments.
With further system refinement, particularly around reuse expansion and material control, the event has strong potential to move closer to a circular model.
Planning a large-scale public or sporting event?
We design waste systems that perform in real-world conditions - reducing landfill, improving efficiency, and delivering measurable results.
Learn more about our event waste management systems